
Every Matrix Monitored. Every Exceedance Predicted.
Environmental laboratories are the front line of ecological protection. LIMSera equips multi-matrix monitoring labs with the field-to-report automation, AI-powered contamination intelligence, and regulatory compliance infrastructure to protect air, water, soil, and communities — across every station and every season.
When Environmental Data Arrives Late, Contamination Has Already Spread.
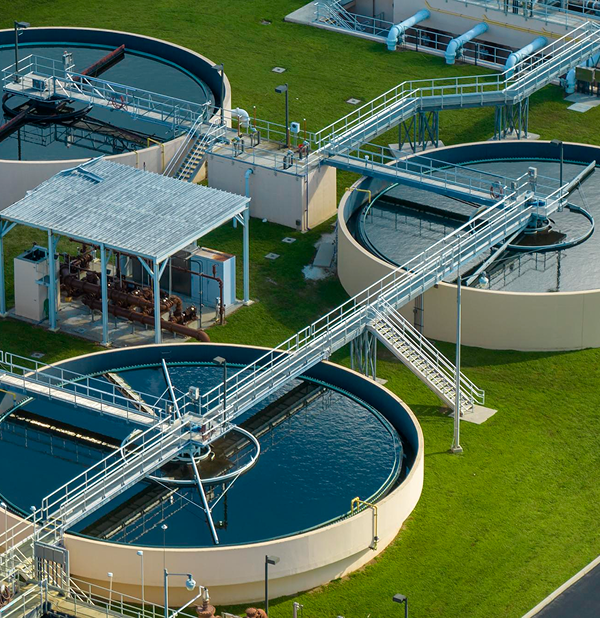
Environmental monitoring laboratories operate across the widest range of sample matrices in the testing industry — surface water, groundwater, effluent, ambient air, stack emissions, soil, sediment, noise, and biological specimens. Each matrix demands its own collection protocols, preservation methods, holding time constraints, analytical techniques, and regulatory compliance standards. A single monitoring campaign can generate hundreds of samples across multiple matrices from dozens of stations.
Most environmental labs manage this complexity with disconnected systems — paper-based field collection, separate databases for each matrix, manual regulatory report compilation, and spreadsheet-based trend analysis. GPS coordinates are hand-written in field notebooks. Holding times are tracked mentally. Exceedances are discovered during report compilation, weeks after the contamination event occurred. Regulatory submissions are assembled manually from data scattered across instruments, registers, and filing cabinets.
LIMSera unifies every matrix, every station, and every regulatory requirement into a single connected platform — so contamination events are detected in real time, compliance is continuous, and regulatory reports compile themselves.
Every Environmental Matrix Your Lab Monitors
Pre-configured for water, air, soil, noise, and ecological monitoring — extensible to any environmental parameter.
Water & Effluent
Monitor surface water, groundwater, drinking water, industrial effluent, and sewage discharge across hundreds of sampling stations worldwide. LIMSera manages physico-chemical, microbiological, heavy metal, and organic pollutant parameters per US EPA, EU Water Framework Directive, WHO guidelines, and national environmental standards globally. AI trend analysis detects contamination patterns across upstream-downstream relationships, seasonal cycles, and industrial activity corridors.
The Environmental Monitoring Chain, End To End
Survey Planning & Scheduling
Define monitoring networks with station locations, sampling frequencies, parameter groups, and responsible field teams. Seasonal and regulatory schedules ensure every station is sampled on time. Survey IDs link each campaign to its regulatory consent condition.
GPS-Verified Field Collection
Field teams collect water, air, soil, and noise samples using the LIMSera mobile app. GPS coordinates, weather conditions, site observations, and photographs are captured at the monitoring station. QR-coded containers are linked to the station by scanning at the site. Full offline operation.
Lab Receiving & Matrix Routing
A single QR scan at the laboratory populates all field data. The system validates sample condition, checks holding times, and routes to the correct analytical section — inorganic chemistry, organic chemistry, microbiology, or heavy metals — with default parameters assigned per matrix and regulatory requirement.
Instrument-Integrated Analysis
Results flow directly from ICP-OES, AAS, GC-MS, HPLC, ion chromatographs, and particulate analysers into LIMSera. The AI engine validates results against regulatory limits, cross-checks correlated parameters, and flags anomalous readings against the station's historical baseline.
Compliance Review & Approval
Results pass through a tiered review workflow with AI-generated compliance summaries. Reviewers see regulatory limit comparisons, historical trends, and flagged exceedances. Each approval is timestamped and attributed. Non-compliant results trigger automated escalation workflows.
Regulatory Report & Submission
The system auto-generates regulatory compliance reports — EPA submissions, EU directive returns, EIA monitoring reports, consent condition statements, and annual environmental summaries per jurisdiction. Reports are formatted per the target regulatory authority and distributed via portal, email, or API.
Visualise All Monitoring Stations On A Single Dashboard.
Every river station, air quality monitor, soil assessment site, noise measurement point, and effluent discharge location — plotted on an interactive geospatial dashboard. Colour-coded markers show compliance status in real time. Drill into any station to see its complete analytical history, trend charts, and regulatory comparison across all parameters.
Heatmap overlays reveal contamination gradients across river basins, industrial corridors, and urban zones. AI-predicted exceedance zones highlight where the next regulatory breach is likely to occur — days or weeks before it happens. Click any alert to see the station, the parameter, the predicted timeline, and the recommended intervention.
Exceedance Detected? Respond Instantly.
When a parameter breaches its limit, the responsible officer is notified within seconds — via SMS, email, and push. AI predicts exceedances days before they occur, giving your team time to intervene rather than react.
Everything Your Environmental Lab Needs
GPS-Tagged Field Sampling
Offline-capable mobile app for environmental sample collection. GPS coordinates, site photos, weather conditions, and field observations captured at every monitoring station.
Multi-Matrix Sample Management
Unified workflow for water, air, soil, sediment, noise, and biological samples. Each matrix carries its own parameter sets, methods, and regulatory compliance rules.
CAAQMS & CEMS Integration
Direct data ingestion from continuous air quality and emission monitoring stations. Real-time parameter dashboards with automatic AQI computation and alert triggers.
Regulatory Compliance Engine
Built-in compliance checking against US EPA, EU directives, EU directives, WHO guidelines, and national environmental standards. Non-compliant results flagged with automated regulatory notification.
Geospatial Environmental Mapping
Interactive maps with colour-coded compliance markers, pollution heatmaps, contamination plume overlays, and AI-predicted exceedance zones across monitoring networks.
AI Contamination Intelligence
Machine learning detects emerging pollution patterns, correlates multi-matrix contamination events, predicts exceedance timelines, and identifies source attribution across industrial zones.
Chain-of-Custody & Audit Trail
Tamper-proof custody records from field collection through lab analysis to regulatory report. Every handoff documented with timestamps, signatures, and condition assessments.
Instrument Calibration & QC
Centralised calibration management for field and laboratory instruments. IQC, proficiency testing records, and measurement uncertainty maintained per ISO/IEC 17025.
Automated Regulatory Reporting
Auto-generated compliance reports in US EPA, EU directives, and EU submission formats. EIA monitoring reports, consent condition compliance, and annual environmental statements.
Exceedance Alerts & Escalation
Real-time alerts when parameters approach or breach regulatory limits. Configurable escalation workflows route notifications to the right authority based on severity and parameter type.
One App. Every Matrix. Every Station. Every Season.
Environmental monitoring spans water bodies, air quality stations, soil assessment sites, noise measurement points, and ecological survey locations — often within the same campaign. The LIMSera field app handles all of them. Field teams navigate to GPS-defined stations, collect the appropriate matrix, record site-specific observations (flow rate for rivers, wind direction for air, depth for soil), and link QR-coded containers to the monitoring point — all in a single, guided workflow.
When a team is sampling at a remote river station with no cellular connectivity, everything works offline. GPS coordinates, weather data, field photographs, and sample metadata are stored locally and synchronised in full when connectivity returns. The system tracks holding times from the moment of collection and alerts the laboratory if samples arrive outside their analytical validity window.
Detect Contamination Patterns. Predict Exceedances. Attribute Sources.
Environmental data is inherently multi-dimensional — the same river receives discharge from multiple industries, agricultural runoff, and municipal sewage. LIMSera's AI doesn't just flag individual exceedances. It identifies patterns across parameters, stations, and time. When COD rises at a downstream station but BOD doesn't change proportionally, the system attributes the contamination to an industrial source rather than organic pollution. When heavy metals appear at a monitoring well, the AI correlates with upstream industrial activity and historical deposition data.
Seasonal forecasting models predict when monsoon dilution will mask contamination, when summer concentration will push parameters toward limits, and when industrial production cycles correlate with emission spikes. These predictions reach the responsible environmental officer with specific station, parameter, and timeline information — not generic alerts.
See Environmental Quality Across Your Entire Monitoring Network.
LIMSera's geospatial dashboard renders every monitoring station on an interactive map. Colour-coded markers show compliance status per matrix — green for within limits, amber for approaching thresholds, red for exceedances. Pollution heatmap overlays reveal contamination gradients across river basins, industrial zones, and urban corridors. Click any station to drill into its complete analytical history, trend charts, and regulatory comparison.
Regulatory reports assemble themselves. Consent condition compliance is tracked per industry client. Regulatory quarterly returns pull from approved data automatically. EIA monitoring reports compile across all environmental components — air, water, noise, soil — into a single formatted submission. Annual environmental statements aggregate twelve months of monitoring into the regulatory authority's required template.

Accreditation & Regulatory Infrastructure Built In.
Immutable Audit Trail
Every sample event, result entry, and approval is timestamped, attributed, and permanently logged. Chain-of-custody integrity from field to regulatory report.
Instrument Calibration
Centralised calibration management for field and laboratory instruments. AI-assisted scheduling, drift detection, and maintenance tracking per ISO 17025.
CAPA & Nonconformance
Structured workflows for analytical deviations, holding time violations, chain-of-custody breaks, and proficiency test failures. Root cause analysis and effectiveness review.
Regulatory Standards
Built-in compliance against US EPA, EU directives, EU directives, WHO guidelines, and national environmental standards. Auto-generated reports in regulatory submission formats.
Designed For Every Role In Environmental Monitoring
GPS-guided station navigation, offline collection, weather logging, photo documentation, and QR-coded sample linking at every monitoring point
Pre-loaded matrix-specific parameters, direct instrument integration, automated holding time validation, and IQC checks for every analytical batch
Multi-matrix trend analysis, contamination source attribution, geospatial pollution mapping, and AI-powered exceedance forecasting
Throughput dashboards, analyst workload management, proficiency test tracking, and ISO 17025 audit readiness
Auto-generated national environmental authority reports, consent condition tracking, exceedance notification management, and inspection documentation
Self-service portal for monitoring report access, compliance certificate download, and real-time environmental dashboard visibility
Frequently Asked Questions
Ready To Modernise Your Environmental Laboratory?
See LIMSera configured for your monitoring matrices, your regulatory requirements, and your station network.
A live walkthrough configured for your laboratory. No generic demos.